
Below is a recent article explaining the growing wealth inequality based on asset ownership and control. This shouldn’t even be phrased as a question as our easy credit policies, massive RE debt leverage, and favored housing policy has created an almost insurmountable wealth divide between the asset-rich and the asset-poor. Who and what policies do we think those left behind are going to be voting for? Non-gender bathrooms? See also Thomas Edsall’s article in the NYT.
Is Housing Inequality the Main Driver of Economic Inequality?
Richard Florida
A growing body of research suggests that inequality in the value of Americans’ homes is a major factor—perhaps the key factor—in the country’s economic divides.
Economic inequality is one of the most significant issues facing cities and entire nations today. But a mounting body of research suggests that housing inequality may well be the biggest contributor to our economic divides.
Thomas Piketty’s influential book, Capital in the Twenty-First Century, put economic inequality—and specifically, wealth inequality—front and center in the global conversation. But research by Matthew Rognlie found that housing inequality (that is, how much more expensive some houses are than others) is the key factor in rising wealth.
Rognlie’s research documented that the share of wealth or capital income derived from housing has grown significantly since around 1950, and substantially more than for other forms of capital. In other words, those uber-expensive penthouses, luxury townhomes, and other real estate holdings in superstar cities like London and New York amount to a “physical manifestation” of Piketty’s insights into wealth inequality, as Felix Salmon so aptly puts it.
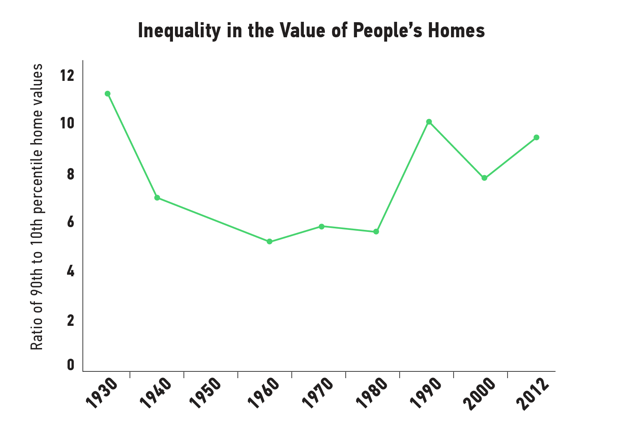
More recent research on this topic by urban economists David Albouy and Mike Zabek documents the surge in housing inequality in the United States. Their study, published as a National Bureau of Economic Research working paper, charts the rise in housing inequality across the U.S. from the onset of the Great Depression in 1930 through the great suburban boom of the 1950s, 1960s, and 1970s, to the more recent back-to-the-city movement, the 2008 economic crash, and the subsequent recovery, up to 2012. They use data from the U.S. Census on both homeowners and renters.
Over the period studied, the share of owner-occupied housing rose from less than half (45 percent) to nearly two-thirds (65 percent), although it has leveled off somewhat since then. The median cost of a home tripled in real dollar terms, according to their analysis. Housing now represents a huge share of America’s total consumption, comprising roughly 40 percent of the U.S. total capital stock, and two-thirds of the wealth held by the middle class.
What Albouy and Zabek find is a clear U-shaped pattern in housing inequality (measured in terms of housing values) over this 80-year period. Housing inequality was high in 1930 at the onset of the Depression. It then declined, alongside income inequality, during the Great Compression and suburban boom of the 1950s and 1960s. It started to creep back up again after the 1970s. There was a huge spike by the 1990s, followed by a leveling off in 2000, and then another significant spike by 2012, in the wake of the recovery from the economic crisis of 2008 and the accelerating back-to-the-city movement.
By 2012, the level of housing inequality in the U.S. looked much the same as it did in the ’30s. Now as then, the most expensive 20 percent of owner-occupied homes account for more than half of total U.S. housing value.
Rents show a different pattern. Rent inequality—or the gap between the cost of rent for some relative than others—was high in the 1930s, then declined dramatically until around 1960. Starting in about 1980, it began to increase gradually, but much less than housing inequality (based on owner-occupied homes) or income inequality. And much of this small rise in rental inequality seems to stem from expensive rental units in very expensive cities.
The study suggests this less severe pattern of rent inequality may be the result of measures like rent control and other affordable housing programs to assist lower-income renters, especially in expensive cities such as New York and San Francisco.
That said, there also is an additional and potentially large wealth gap between owners and renters. Homeowners are able to basically lock in their housing costs after purchasing their home, and benefit from the appreciation of their properties thereafter. Renters, on the other hand, see rents increase in line with the market, and sometimes faster. This threatens their ability to maintain shelter, while they accumulate no equity in the place where they live.
***
But what lies behind this surge in housing inequality? Does it stem from the large housing-price differences between superstar cities and the rest, or does it stem from inequality within cities and metro areas—for instance, high-priced urban areas and suburban areas compared to less advantaged neighborhoods?
The Albouy and Zabek study considers three possible explanations: The change over time from smaller to larger housing units; geographic or spatial inequality between cities and metro areas; and economic segregation between rich and poor within metro areas.
Even as houses have grown bigger and bigger, with McMansions replacing bungalows and Cape Cods in many cities and suburbs since the 1930s (as the size of households shrunk), the study says that, at best, 30 percent of the rise in housing inequality can be pegged to changes in the size of houses themselves.
Ultimately, the study concludes that the rise in both housing wealth and housing inequality stems mainly from the increase in the value of land. In other research, Albouy found that the value of America’s urban land was $25 trillion in 2010, roughly double the nation’s 2016 GDP.
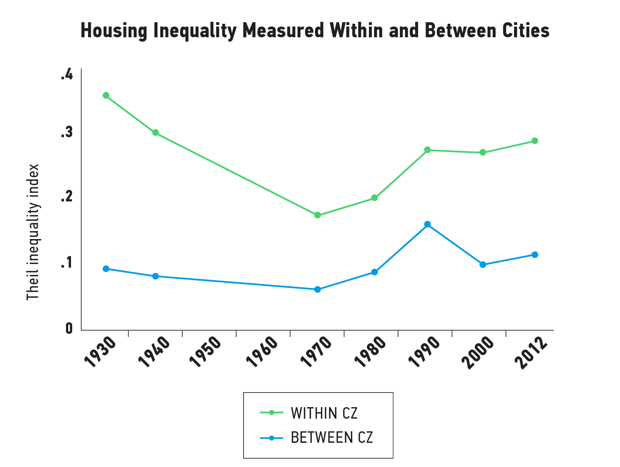
But here’s the kicker: The main catalyst of housing inequality, according to the study, comes from the growing gap within cities and metro areas, not between them. The graph below shows the differences in housing inequality between “commuting zones”—geographic areas that share a labor market—over time. In it, you can see that inequality varies sharply within commuting zones (marked “CZ”) while it remains more or less constant between them.
In other words, the spatial inequality within metros is what drives housing inequality. Factors like safety, schools, and access to employment and local amenities lead individual actors to value one neighborhood over the next.
All this forms a fundamental contradiction in the housing market. Housing is at once a basic mode of shelter and a form of investment. As this basic necessity has been transformed over time into a financial instrument and source of wealth, not only has housing inequality increased, but housing inequality has become a major contributor to—if not the major overall factor in—wealth inequality. When you consider the fact that what is a necessity for everyone has been turned into a financial instrument for a select few, this is no surprise.
The rise in housing inequality brings us face to face with a central paradox of today’s increasingly urbanized form of capitalism. The clustering of talent, industry, investment, and other economic assets in small parts of cities and metropolitan areas is at once the main engine of economic growth and the biggest driver of inequality. The ability to buy and own housing, much more than income or any other source of wealth, is a significant factor in the growing divides between the economy’s winners and losers.


